
Analyzing Stock Charts
4 posters
Page 1 of 1

Analyzing Stock Charts
![]() lukera Fri Nov 12, 2010 7:55 am
lukera Fri Nov 12, 2010 7:55 am
So I have been doing as much homework on investing every night as the wife will let me. But as I have said before everytime I figure something out it leads to two or three more questions.
Fred mentioned yesterday that a stock I had recently bought had a very high RSI (Relative strength index) so i thought i would look into it.
I went to my trading platform and charted the stock along with the RSI lines and as it turns out fred was right (RSI - 80)!
My question is; is there a valid way to pick stocks based on just the chart? can I use a combination of charting alaytic methods ie. RSI and bollinger bands to determine if the stock is a viable one?
Chart Example (Top is Bollinger Bands, bottom RS index):
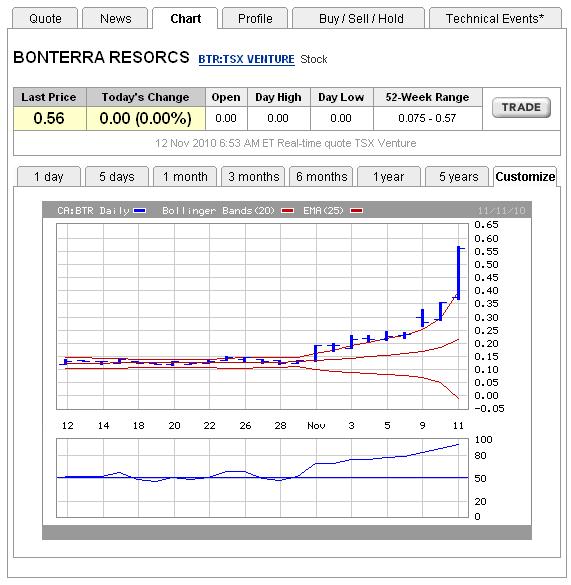
By looking at these charts, both methods are telling me to sell from what i understand.
Fred mentioned yesterday that a stock I had recently bought had a very high RSI (Relative strength index) so i thought i would look into it.
I went to my trading platform and charted the stock along with the RSI lines and as it turns out fred was right (RSI - 80)!
My question is; is there a valid way to pick stocks based on just the chart? can I use a combination of charting alaytic methods ie. RSI and bollinger bands to determine if the stock is a viable one?
Chart Example (Top is Bollinger Bands, bottom RS index):
By looking at these charts, both methods are telling me to sell from what i understand.

lukera- Admin
- Posts : 174
Reputation : 0
Join date : 2010-07-01
Age : 43
Location : sault ste. marie, on
Re: Analyzing Stock Charts
![]() Max Fri Nov 12, 2010 10:58 am
Max Fri Nov 12, 2010 10:58 am
Charting is one tool of many, and not one I am a fan of. I admit, I don't have enough familiarity, so I welcome some more education on the subject. There is for sure some legitimacy to it, and I feel I would be a much better investor if I understood it better.
Keep in mind that a lot of the charting patterns ignore what is actually going on with the stock (news, financial results, etc...) If you can find a way to combine the two, you will have a much better chance for success than looking at charts alone. For example, if a $3 stock reaches $2, and the RSI says it is oversold, but in fact, they just had some event that permanently destroyed value (lets say a mine collapse), then it would be a mistake to buy the stock.
I look forward to hearing some plain english translations of what RSI means to you and the psychology behind it. When I hear these charting guys talk about resistance levels like that is a certain predictor of where the stock is going, my eyes glaze over because it just sounds like total nonsense. Yes the stock trades within a range.... until it doesnt. Then a new range..... until it doesnt. Relying on the past to determine the future has had a very poor short term track record.
Max- SDDL Insider

- Posts : 297
Reputation : 7
Join date : 2010-07-01
Re: Analyzing Stock Charts
![]() jon Fri Dec 03, 2010 6:16 pm
jon Fri Dec 03, 2010 6:16 pm
To me , technical analysis has no real value , I just don't have the time or the insight to use it , turns out for me anyways , that my gut feeling and perception of investor sentiment works very well.
Check out this for RSI: http://stockcharts.com/help/doku.php?id=chart_school:technical_indicators:relative_strength_in
Now if I have to know all that just to understand one simple aspect of T/A , imagine what I would have to learn to take all points of T/A into consideration , and who knows if it would be any better than their own analysis.
It's way over my head anyway.
If simple investors like me want to have some T/A input , try this site , it does all of the calculations for you , just punch in the ticker symbol.
http://www.barchart.com/opinions/stocks/YHOO
That said , some traders use T/A exclusively and do very well at it , go figure.

jon- Posts : 27
Reputation : 0
Join date : 2010-11-26
Re: Analyzing Stock Charts
![]() Fred Sat Dec 04, 2010 10:45 am
Fred Sat Dec 04, 2010 10:45 am
The RSI link was a good read. Thanks. To add a little to this discussion, I also believe it is important to know the stock you are looking at. If you have been watching it for some time and maybe know quite a bit about the organization, you will tend to have better judgment about how the stock behaves based on its history. All the different ways of interpreting the data and analysing charts could hurt you in the end if you don't know the stock. I not one to rely on any technical analysis either... I ask to see what others opinions are, but its not my style to analyse the numbers or rely on them. When it comes down to it, most of my decisions are based on gut instincts regarding some potential a company has, some history I know about, and the indicatios I use to follow stock behavioural trends. It's not perfect, but its working for me.
Fred- SDDL Insider
- Posts : 125
Reputation : 5
Join date : 2010-07-01
Age : 42
Location : Sault Ste. Marie, On -

Page 1 of 1
Permissions in this forum:
You cannot reply to topics in this forum